
|
Graphics
|
Global
|
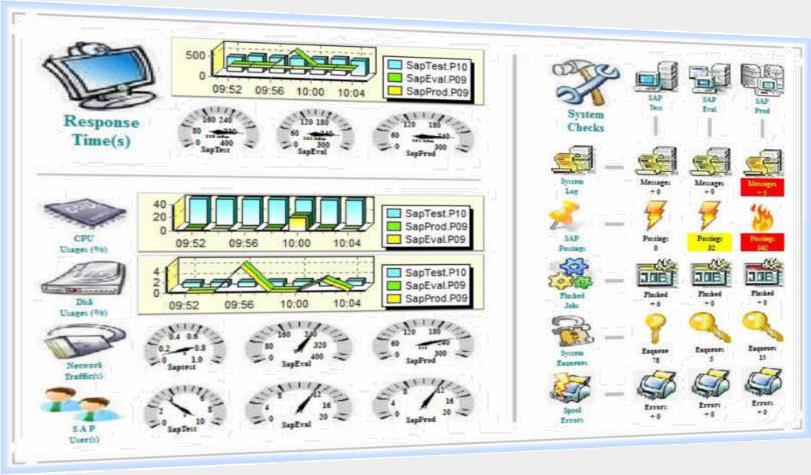
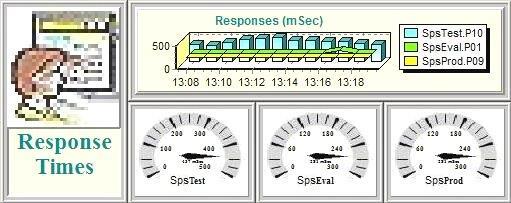
Beside the inquires of the values from a single Snmp-System you are able to request a single value from a group of Snmp-Sytems. This informations could be presented by Graphics on the Dashboard.
With the request of a value from a group of Snmp-Systems only a single value is requested out of the group. This informations could be presented via a Graphic. Additionally you can add "Gauges" or your own "Images" to the Dashboard.
In the sample above a Dashboard is shown with general informations and a matrix which is organized by systems and functions.
All the sensors could be modified by layout, size and position during runtime. New sensors could be added at any time. You are able to design your own layout.