SpsEyes | Active Dashboard for SPS System's |
|
|||||||||||||||||||||||||||||||||||||||||||
|
|||||||||||||||||||||||||||||||||||||||||||||
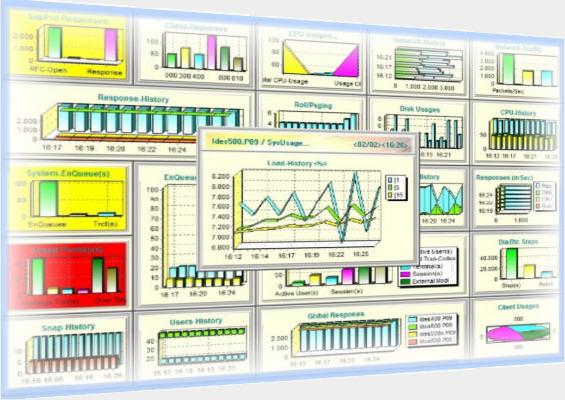
All objects could be shown on the Dashboard by graphics or charts. The layout of the charts could be changed and modified at runtime. There are following charts available:
|
|||||||||||||||||||||||||||||||||||||||||||||
Bars
|
Bar-Diagram |
Area
|
Area-Diagram | ||||||||||||||||||||||||||||||||||||||||||
SLine
|
Bars / Lines |
Lines
|
Lines-Diagram | ||||||||||||||||||||||||||||||||||||||||||
After you placed an object on the Dashboard by the Profiler, the object could be handled at runtime. It could be changed by colours and the behaviour by assigned rules.
|
Vertics
|
Vertical Bars |
Points
|
Points-Diagram | |||||||||||||||||||||||||||||||||||||||||
Stacks
|
Bars stacked |
Pie's
|
Pie-Diagramm | ||||||||||||||||||||||||||||||||||||||||||
Chart
|
Shown as a Diagram | ||||||||||||||||||||||||||||||||||||||||||||
Flow
|
Shown as a Flowing | ||||||||||||||||||||||||||||||||||||||||||||
List
|
Shows the Listing | ||||||||||||||||||||||||||||||||||||||||||||
|
|||||||||||||||||||||||||||||||||||||||||||||
ICON Software GmbH | |||||||||||||||||||||||||||||||||||||||||||||
Mail: Info@Icon-Software.de | |||||||||||||||||||||||||||||||||||||||||||||