
|
Graphics
|
|
Graphics
|
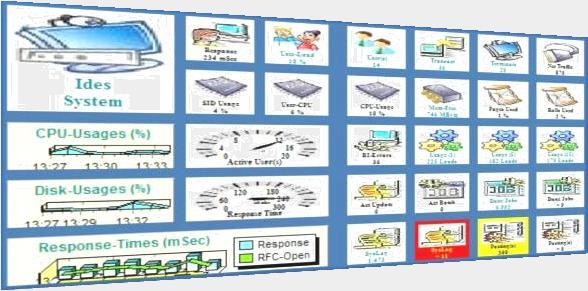

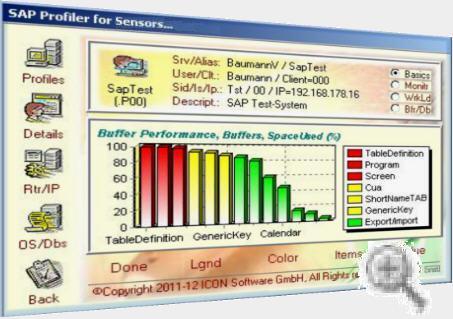
With the SAP Profiler the layout of the object for the dashboard is predefined. Within the Active Dashboard you are able to modify the layout and the type of presentation.
After starting the object with the Profiler the object will be autonomous. In defined intervals it requests the values from SAP via RFC and compared with the given rules. The actual state of the object will be shown by colours. Every object within the dashboard contacts a single or a group of SAP-Systems. The resulting will be placed via a chart directly on the screen.
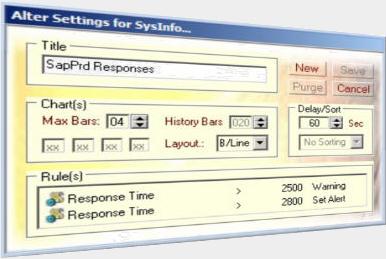
After the fixing the object within the dashboard you are able to customize them. You can at any time modify the layout, the chart and the rules.
Chart
Gauge
Image